
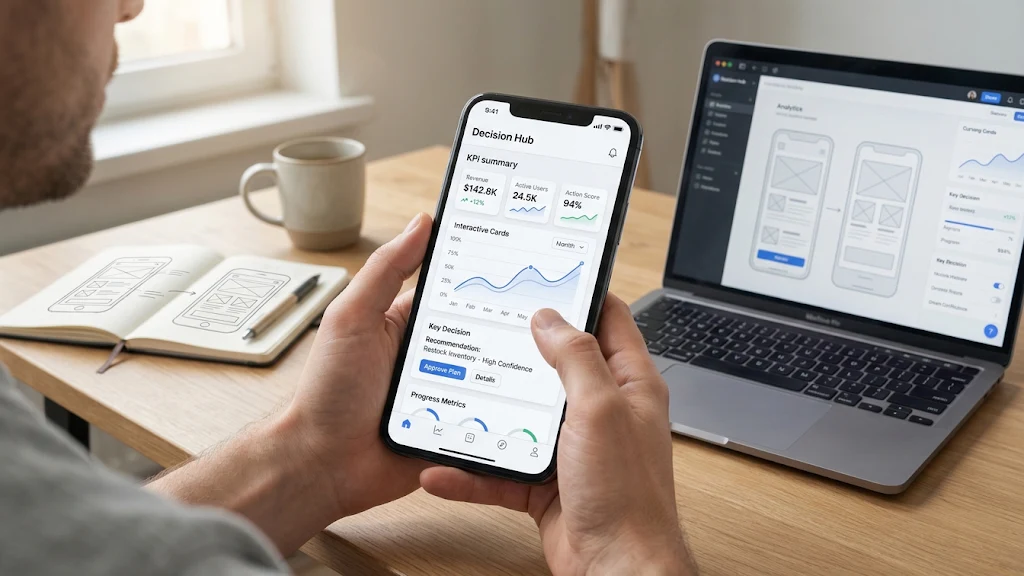
Mobile Dashboard Design for Clearer Decisions
A mobile dashboard is not a compressed desktop report. It is a decision tool for people who may be standing in a warehouse, moving between meetings, checking a route, or responding to an alert. Reviewing strong dashboard UI design examples can help teams see how focused layouts, clear status cues, and deliberate spacing make complex information easier to scan.
The goal is not to display every available metric. The goal is to help a user understand what matters, decide what to do next, and act without fighting the interface. When a dashboard reduces noise instead of adding it, a smaller screen becomes an advantage because it forces the product team to prioritize.
Why Mobile Dashboards Need a Different Approach
Desktop dashboards often support exploration. Users can compare several charts, open reports, adjust controls, and study details over time. Mobile use is usually more immediate. A sales manager may want today’s pipeline risk, a field technician may need the next service priority, and a delivery lead may need to know whether a delay requires action.
Trying to preserve every desktop feature usually produces crowded cards, tiny labels, and unclear actions. Mobile dashboard guidance from designing dashboards for mobile devices similarly emphasizes keeping the experience simple, understanding the end user, and avoiding an attempt to recreate a complete desktop dashboard on a phone. Build for a specific mobile job, then let deeper analysis live elsewhere.
Start With the User’s Main Question
Before choosing a chart or arranging cards, define the question the dashboard must answer. A sales manager may ask, “Which account needs attention today?” A technician may ask, “What is the most urgent job nearby?” A fitness app user may ask, “Am I on pace to meet this week’s goal?” Each question leads to a different screen.
- Identify the user’s role and working context.
- List the decisions that person can realistically make on mobile.
- Separate urgent signals from useful background information.
- Remove metrics that do not support a task or decision.
- Define the next action the user should be able to take.
Choose the Right Information Hierarchy
Information hierarchy turns a list of metrics into a useful interface. Put the most important status, exception, or performance figure near the top. Group related information into short sections, use direct labels, and leave enough spacing for users to distinguish one subject from another.
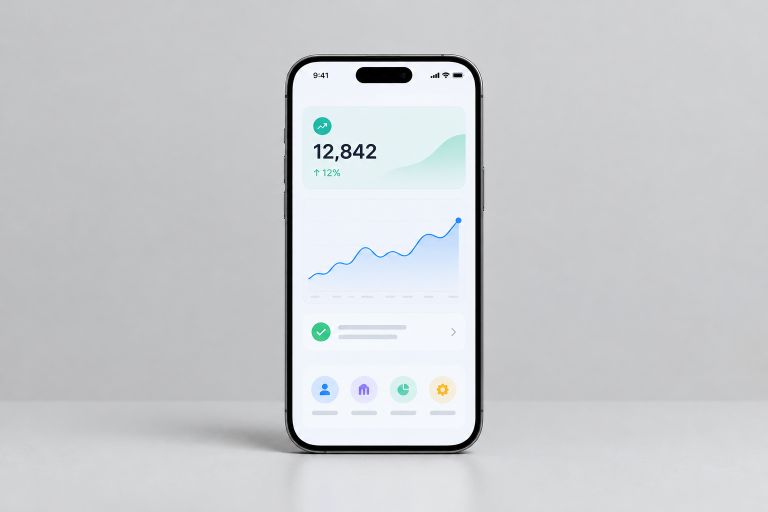
A strong opening view may contain one primary metric, a short explanation of its meaning, and one supporting trend. Secondary details can appear after a tap. This approach makes the first screen useful in seconds while preserving access to deeper information for users who need it.
Design Charts for Fast Reading
Choose a chart according to the question, not because it looks sophisticated. Line charts work well for change over time. Bar charts support direct comparisons. Progress indicators are useful when users need to judge completion against a target. Place the takeaway close to the visual, such as “Response time is improving” or “Three locations are below target.”
Avoid crowded legends, dense grids, and labels that can only be read after zooming. Hover tooltips do not translate to touch screens, so let users tap a chart point or bar to reveal detail. When fast action matters, a clearly labeled indicator can be more effective than a complex visualization.
Make Touch Interactions Clear
Touch interfaces need visible, forgiving controls. Buttons and selectable rows should be comfortably sized, placed where they are easy to reach, and labeled with the result of the action. “View delayed orders” is clearer than an isolated icon that could mean several things.
Do not hide essential actions behind unfamiliar gestures. Swiping can be a useful shortcut, but a user should still be able to discover and complete the task through visible controls. After a tap, provide immediate feedback through a changed state, confirmation message, loading indicator, or updated selection.
Handle Tables, Filters, and Drill-Downs
Tables are difficult on narrow screens because comparison often depends on seeing several columns at once. First ask whether users truly need a table. If they need to identify a single record, stacked summary cards may work better. If they need to compare values across records, limit the view to the columns that support that comparison.
- Remove columns unrelated to the main task.
- Use filters to reduce the visible data set before showing results.
- Keep filter labels short, specific, and easy to reset.
- Use horizontal scrolling only when side-by-side comparison is essential.
- Reveal advanced data through drill-downs instead of placing it all on the opening screen.
Build for Accessibility and Contrast
Accessibility belongs in the first wireframe. Status should never depend on color alone. Pair color with plain-language text, icons, patterns, or labels such as “At risk,” “On track,” and “Needs review.” Chart controls, buttons, and icons also need meaningful names so people using assistive technology can understand them.
Readable text needs a clear relationship with its background. The WCAG guidance on minimum text contrast describes a 4.5:1 contrast ratio for normal text at Level AA. Test larger text settings, zoom, keyboard focus where applicable, and long labels before release.
Plan for Real-World Screen States
A polished screen with perfect data is only one state of the product. Design loading, empty, error, offline, permission-restricted, and out-of-date states intentionally. Explain what happened, what information is still available, and what the user can do next.
For example, a delivery manager who sees no route updates needs to know whether no deliveries are delayed, the data feed is delayed, or the phone has lost its connection. Those are different situations and should not share the same blank screen.
Test the Dashboard With Real Tasks
Test behavior, not just visual preference. Give participants realistic tasks, use representative data, and observe where they hesitate, tap the wrong element, or misunderstand a metric. Test several screen sizes and include edge cases such as long customer names, unusual values, and incomplete records.
Measure task completion, time, errors, and confidence. Ask users to explain what they believe a metric means before asking whether they like the interface. Then revise the hierarchy, labels, and interactions and test again.
Common Mobile Dashboard Mistakes
- Copying a desktop layout without changing content priority.
- Showing too many cards before the user reaches the main answer.
- Using decorative charts that do not support a decision.
- Relying on hover behavior or tiny text.
- Hiding important actions inside unclear icons.
- Ignoring empty, error, offline, and stale-data states.
- Testing only with ideal sample data.
Final Checklist
- Does the dashboard answer a clear user question?
- Can users find the most important metric within seconds?
- Are charts, labels, and touch targets easy to use on a small screen?
- Can users understand status without relying only on color?
- Do filters and drill-downs reduce clutter rather than add it?
- Are loading, empty, error, offline, and permission states covered?
- Has the design been tested with realistic tasks and data?
Conclusion
The best mobile dashboards are not defined by the amount of data they display. They are defined by how quickly they help someone understand a situation and respond appropriately. Prioritize the main question, reduce visual noise, design for touch, support accessibility, and validate the experience under real conditions. A focused dashboard will usually deliver more value than a crowded one.